slurmpic
slurmpic (SLURM PICture) is a JHPCE-written program which is an important tool for both users and systems administrators. You should run slurmpic regularly to get a feeling for the state of the cluster, and whenever you are wondering about something such as why a node or partition you explicitly requested is not available (e.g. a node might be down). Run slurmpic -h to see important usage notes!
It shows current information about individual compute nodes and partitions (groups of compute nodes). When slurmpic --all is run, it shows info about all of the nodes in the cluster, and therefore the statistics provided are for the whole cluster. Text is color-coded to try to indicate how fully consumed nodes are.
The command takes these arguments:
slurmpic [-p|--partition <PARTITION>] [-a|--all] [-g|--gpu] [-r|--ramstats]
slurmpic [-h|--help]
The SLURM command "sinfo --node" is the underlying tool. That produces a node-oriented format with one line per node. slurmpic modifies sinfo output by adding color-coding, a little upper/lower case modifications for NODESTATE and a summary block of statistics about the nodes displayed.
Why is it useful?
The per-node lines give you specific answers to questions like:
- "How heavily utilized is a partition or the cluster is at this moment?"
- "What is the maximum amount of RAM and CPU cores on a single node in the cluster or partition?" A basic SLURM job requires all of the specified resources to exist on a single node. If you try to submit a job request which specifies more of either resource than those maximums, then the job will be rejected -- because no node can ever accept such a job. (You'll need to divide up the computing effort.)
- "Which nodes or partitions have available capacity that my job might be able to use now or in the near future?" The
slurmpicoutput will give you an idea of what is possible/likely to run now. Of course, your jobs are submitted into a queue of jobs from other users, and various factors will determine the order in which they are dispatched to a particular node. Also, sometimes you will be reminded of partitions like "scavenge" or "interactive-larger" and see that they have available resources. (You can see descriptions & limitations of our partitions here.)
Example output
Here is a condensed example of the output from running slurmpic --all on the JHPCE/JASPER cluster:
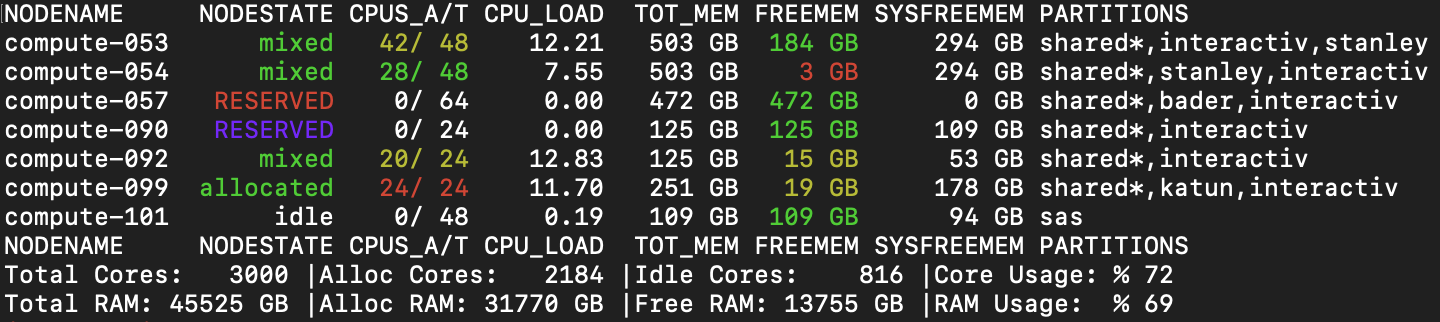
Notes:
- Later sections of this document provide details about the columns & color-coding.
- Because we used
--all, the PARTITIONS column lists all of the partitions that the node is a member of. - compute-053's cores are almost all used, so CPUS_A/T is a cautionary yellow. But it has enough unallocated RAM to be able to run more SLURM jobs, so FREEMEM is in green. The NODESTATE is "mixed" because it is being used but neither CPU nor RAM are 100% allocated.
- compute-054's still has many free cores, so CPUS_A/T is green. But it has almost no unallocated RAM for more SLURM jobs, so FREEMEM is in danger red.
- compute-057 is turned off and reserved, so RESERVED is in red.
- compute-090 is working normally and is reserved, so RESERVED is in purple.
- compute-099's NODESTATE is "allocated" because all of its cores are in use.
- compute-101 is idle.
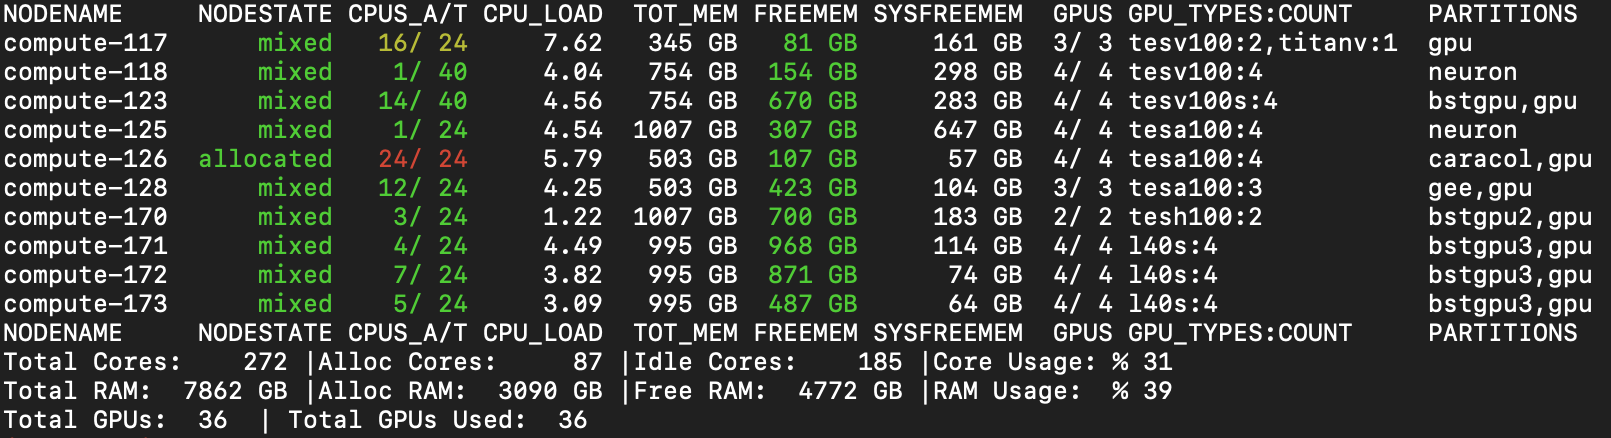
Example of slurmpic --gpu on the JHPCE/JASPER cluster:
Which partitions do you see?
- By default
slurmpicdisplays one partition, whileslurmpic -ashows all partitions. slurmpic -aallows you to see which partitions a node belongs to.- Your default partition is shown with an asterisk.
- In the JHPCE cluster: slurmpic defaults to the shared partition.
- In the JADE cluster: slurmpic defaults to the N-shared partition, where "N" is the community letter, e.g. "c-shared" for CMS community members, "m-shared" for MISC community members. (On JADE, that is the one defined in your
~/.slurm/defaultsfile.) - Specific partitions can be displayed using:
slurmpic -p <partition_name> - All of the nodes in all of the GPU partitions can be displayed with
slurmpic -g. - Individual GPU-containing partitions can be shown with
slurmpic -g -p <partition_name> - You will not see hidden or restricted partitions you cannot submit to, unless you specify
-a. Partitions can be hidden from view because of their configuration in two ways: They can be defined as hidden (which we haven't done so far). Partitions can also be configured with an "AllowedGroups" parameter. That restricts usage to members of the specified UNIX user group members. It also hides the partition's nodes in the default output of SLURM commands. Thesinfo -aoption is documented to toggle the visability.
About the displayed summary statistics:
- They are for a single partition, not the whole cluster (except for
slurmpic -a) - They do not include the resources of hidden or restricted partitions.
- Memory and CPU use of nodes that are DOWN, in DRAIN or are RESERVED are not included in the stats.
Column names and contents
Typically you will see this header line:
NODENAME NODESTATE CPUS_A/T CPU_LOAD TOT_MEM FREEMEM SYSFREEMEM PARTITIONS
When you add the -g (for gpu) flag, two additional columns are shown:
NODENAME NODESTATE CPUS_A/T CPU_LOAD TOT_MEM FREEMEM SYSFREEMEM GPUS GPU_TYPES:COUNT PARTITIONS
When you add the -r (for RAM stats) flag, three additional columns are shown:
NODENAME NODESTATE CPUS_A/T CPU_LOAD TOT_MEM FREEMEM SYSFREEMEM ALLOC USED GAP PARTITIONS
- NODENAME - self-explanatory
- NODESTATE - SLURM has a finite set of "states" a node can be in at a time. Slurmpic usually only shows one but nodes can be in several simultaneously. (The command
scontrol show node <nodename> | grep STATEwill show you all of the current states. Seeman sinfofor a list of states.) - CPUS_A/T - CPU Allocated by SLURM and total CPU
- CPU_LOAD - The current average number of processes that are either in a runnable or uninterruptable state.
- TOT_MEM - The total amount of RAM on the compute node available for SLURM jobs.
- FREEMEM - Currently unused RAM available for new jobs.
- SYSFREEMEM - The operating system's idea of RAM that is not being used for any purpose. Users can ignore this data.
- PARTITIONS - One or more partitions that the node is a member of.
- GPUS - (gpus option) Two numbers: GPU cards in use and total installed.
- GPU_TYPES:COUNT - (gpus option) A list of GPU card models & how many of them are being used.
- ALLOC - (ramstats option) Total of SLURM job requests (equals TOT_MEM - FREEMEM)
- USED - (ramstats option) Amount of memory being used for something (equals TOT_MEM - SYSFREEMEM)
- GAP - (ramstats option) Difference between what users have requested and what the operating system says is not being used (equals SYSFREEMEM - FREEMEM)
Color-coding used in column contents
The cut-off points for color choices are hard-coded in slurmpic. You can inspect the code yourself to see what is being done.
NODESTATE
Green: The node is running and SLURM can contact it.
Red: The node is in distress.
Purple: Only used for state RESERVED. The node is running but has a reservation in place. The command showres will list reservations and their details. Nodes which are reserved but also down are shown in red.
CPUS_A/T
White: No cores are being used.
Green: A few cores are being used.
Yellow: Most of the cores are being used.
Red: Almost all or all cores are being used.
CPU_LOAD
We have not, to date, colorized this field. Perhaps we should be calling out load averages higher than the number of total cores, as that indicates problems such as programs believing they have access to all of the cores on the node e.g. the Python "plink" libraries.
FREEMEM
Green, yellow or red depending on the amount of currently unused RAM available for new jobs.
GAP
Various colors which attempt to indicate the scale of over-allocation of RAM by users. This was implemented to provide some informatiom about the scale of over-allocation, so systems administrators could choose courses of action. Such as creating scripts which emailed users who used "much too much" RAM recently. These values are very approximate. For example, FREEMEM is what SLURM thinks is usable, not what the OS does. SYSFREEMEM depends on how much RAM is being used by the OS for caching data such as recently-used files.
Not colorized
We have not, to date, colorized these fields:
- NODENAME
- TOT_MEM
- SYSFREEMEM
- GPUS
- GPU_TYPES:COUNT
- ALLOC
- USED
- PARTITIONS
Caveats
- Summary stats are for specified partition(s), and the values for nodes in DOWN, DRAIN & RESERVED states are excluded. The philosophy implemented is "What CPU & RAM figures apply to most users when they submit new jobs?"
- Output width - You may need to widen your terminal window. One hundred (110) characters should suffice when looking at GPU info.
- The JADE cluster does not have any GPU-equipped nodes. Therefore the
--gpuoption does not produce useful info there. - The count of GPUs when using
-gis how many are currently running code, not the number locked down by SLURM job requests. Therefore it can appear that GPUs are available when they are not. - Using
--all&--gputogether provides (as of 20261003) different output depending on the ordering. Ordering should not matter.slurmpic -g -awill show all cluster nodes, with GPU-related statistics.slurmpic -a -gwill show only GPU-equipped nodes, with GPU-related statistics.
RAM usage stats
The -r | --ramstats flag was added to assist systems administrators to get a feeling for how much users were over-allocating RAM when composing their job requests.
Slurmpic data tools
To be written.
((Describe here the ways to look at historical data -- see the slurm local commands page for starting info.))
Candidates include:
slurm-hist slurm-hist-all-cores slurm-hist-all-mem slurm-hist-shared-cores slurm-hist-shared-mem